Regarding the economic features, in the first place, MERCOSUR uses an integration strategy called "open regionalism" which is based on seeking to increase integration with neighboring countries, also aiming to eliminate or reduce barriers to integration with the rest of the world. (Zona Económica, n.d.)
Regarding the economic features, in the first place, the total annual GDP of MERCOSUR in 2018 was 2,627,535M.$, being the Brazil GDP the greater than the rest of members with a 1,867,818M.$. Likewise, the total GDP per capita in the same year was 8,622$ (Country Economy, n.d.) At the beginning of MERCOSUR, in 1995, Brazil accounted for about 70% of the total GDP of Mercosur, because its economic performance, domestic policies, and negotiating position within the bloc, which had a major impact on the overall development of the integration process, methodology, and agenda. (Roett, R., 1999). Moreover, the followed table shows the real GDP of all South-America, in 2018 and its prediction to 2019 and 2020:
(International Monetary Fund, 2019)
Also, the followed table shows some of the main economic features of MERCOSUR:
(Cienfuegos, M., et al,2010)
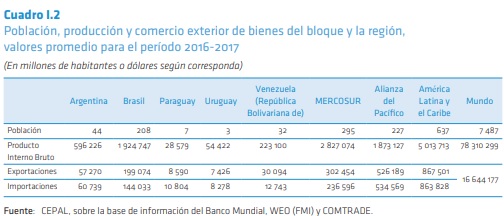
In second place, MERCOSUR represent a bit more than half of GDP of Latin America and the Caribbean, with 56,4%, and about a 46,2% of its population. However, the heft of the exportations and importations of the goods are significative lower with 34,9% and 25,4% respectively. The table below shows the population, GDP and internal trade of the goods within the organization and the region between 2016-2017:
(CEPAL, 2018)
Likewise, MERCOSUR is a major global supplier of plant products (13%), food and beverages (8%), fats and oils (7%), animals and their produce (7%), and stands out for its weight in world exports of soybeans and their derivatives (60%), sugar (more than half), tanned leathers (35%), tannins (one third), flexible iron or steel tubes (one third), corn grain (30% ), meats (around 30% in avian and more than 20% in bovine), tobacco (25%), wood pulp (20%), coffee (17%), among other goods. (CEPAL, 2018) The impact that MERCOSUR has on intra-regional trade is explained by what happens within the block itself: 59% of the total exports made by MERCOSUR to the region are directed to MERCOSUR itself and the remaining 41% to other regional partners. In the same sense, 66% of what MERCOSUR imports from the region originates from countries of the block itself. The reasons of the intensity of intra-block trade are mainly the geographical proximity, the existence of common sectoral regimes and the absence of tariffs (with the shown exceptions before). The countries of the block account for 56% of exports and 48% of intra-regional imports of the goods. (CEPAL, 2018) The followed graphs show the exportations and importations of MERCOSUR for 2007-2019:
(Mercosur)
References:
CEPAL. (2018) El rol del MERCOSUR en la integración regional, Boletín de Comercio Exterior del MERCOSUR, Nº 1, Santiago, Comisión Económica para América Latina y el Caribe (CEPAL), 2018. Retrieved from https://repositorio.cepal.org/bitstream/handle/11362/44298/1/S1801158_es.pdf
Cienfuegos, M., Ayuso, A., Cobos, P., Ramírez. X. (2010). Oportunidades de negocios en la situación actual de integración regional en Sudamérica. Universitat Pompeu Fabra: Orla
Country Economy (n.d.) MERCOSUR - Southern Common Market. Retrieved from https://countryeconomy.com/countries/groups/mercosur
International Monetary Fund.(2019). World Economic Outlook: Global Manufacturing Downturn, Rising Trade Barriers. Washington, DC, October. Retrieved from https://www.imf.org/~/media/Files/Publications/WEO/2019/October/English/text.ashx?la=en
Zona Económica.(n.d.) ¿Qué es el regionalismo abierto? Retrieved from https://www.zonaeconomica.com/regionalismo-abierto
MERCOSUR (n.d.) SECEM. Retrieved from https://estadisticas.mercosur.int/
Zona Económica.(n.d.) ¿Qué es el regionalismo abierto? Retrieved from https://www.zonaeconomica.com/regionalismo-abierto
MERCOSUR (n.d.) SECEM. Retrieved from https://estadisticas.mercosur.int/


Comments
Post a Comment